Global 3D Secure rates: Country data comparison 2025
Which countries are performing better in terms of SCA and 3D Secure? Where are the highest and lowest authentication rates and frictionless rates? Who could do better in terms of authentication and who has set a shining example?
10 April 2025
Sourced internally and anonymized, the data we’re presenting in this article came from our payment fraud and optimization recommendations, as well as managing authentication itself:
3DS authentication rates,
3DS challenge authentication rates,
frictionless authentication rates.
Fraud and payments professionals can leverage this knowledge to improve their performance across different regions, as well as manage culture-specific expectations.
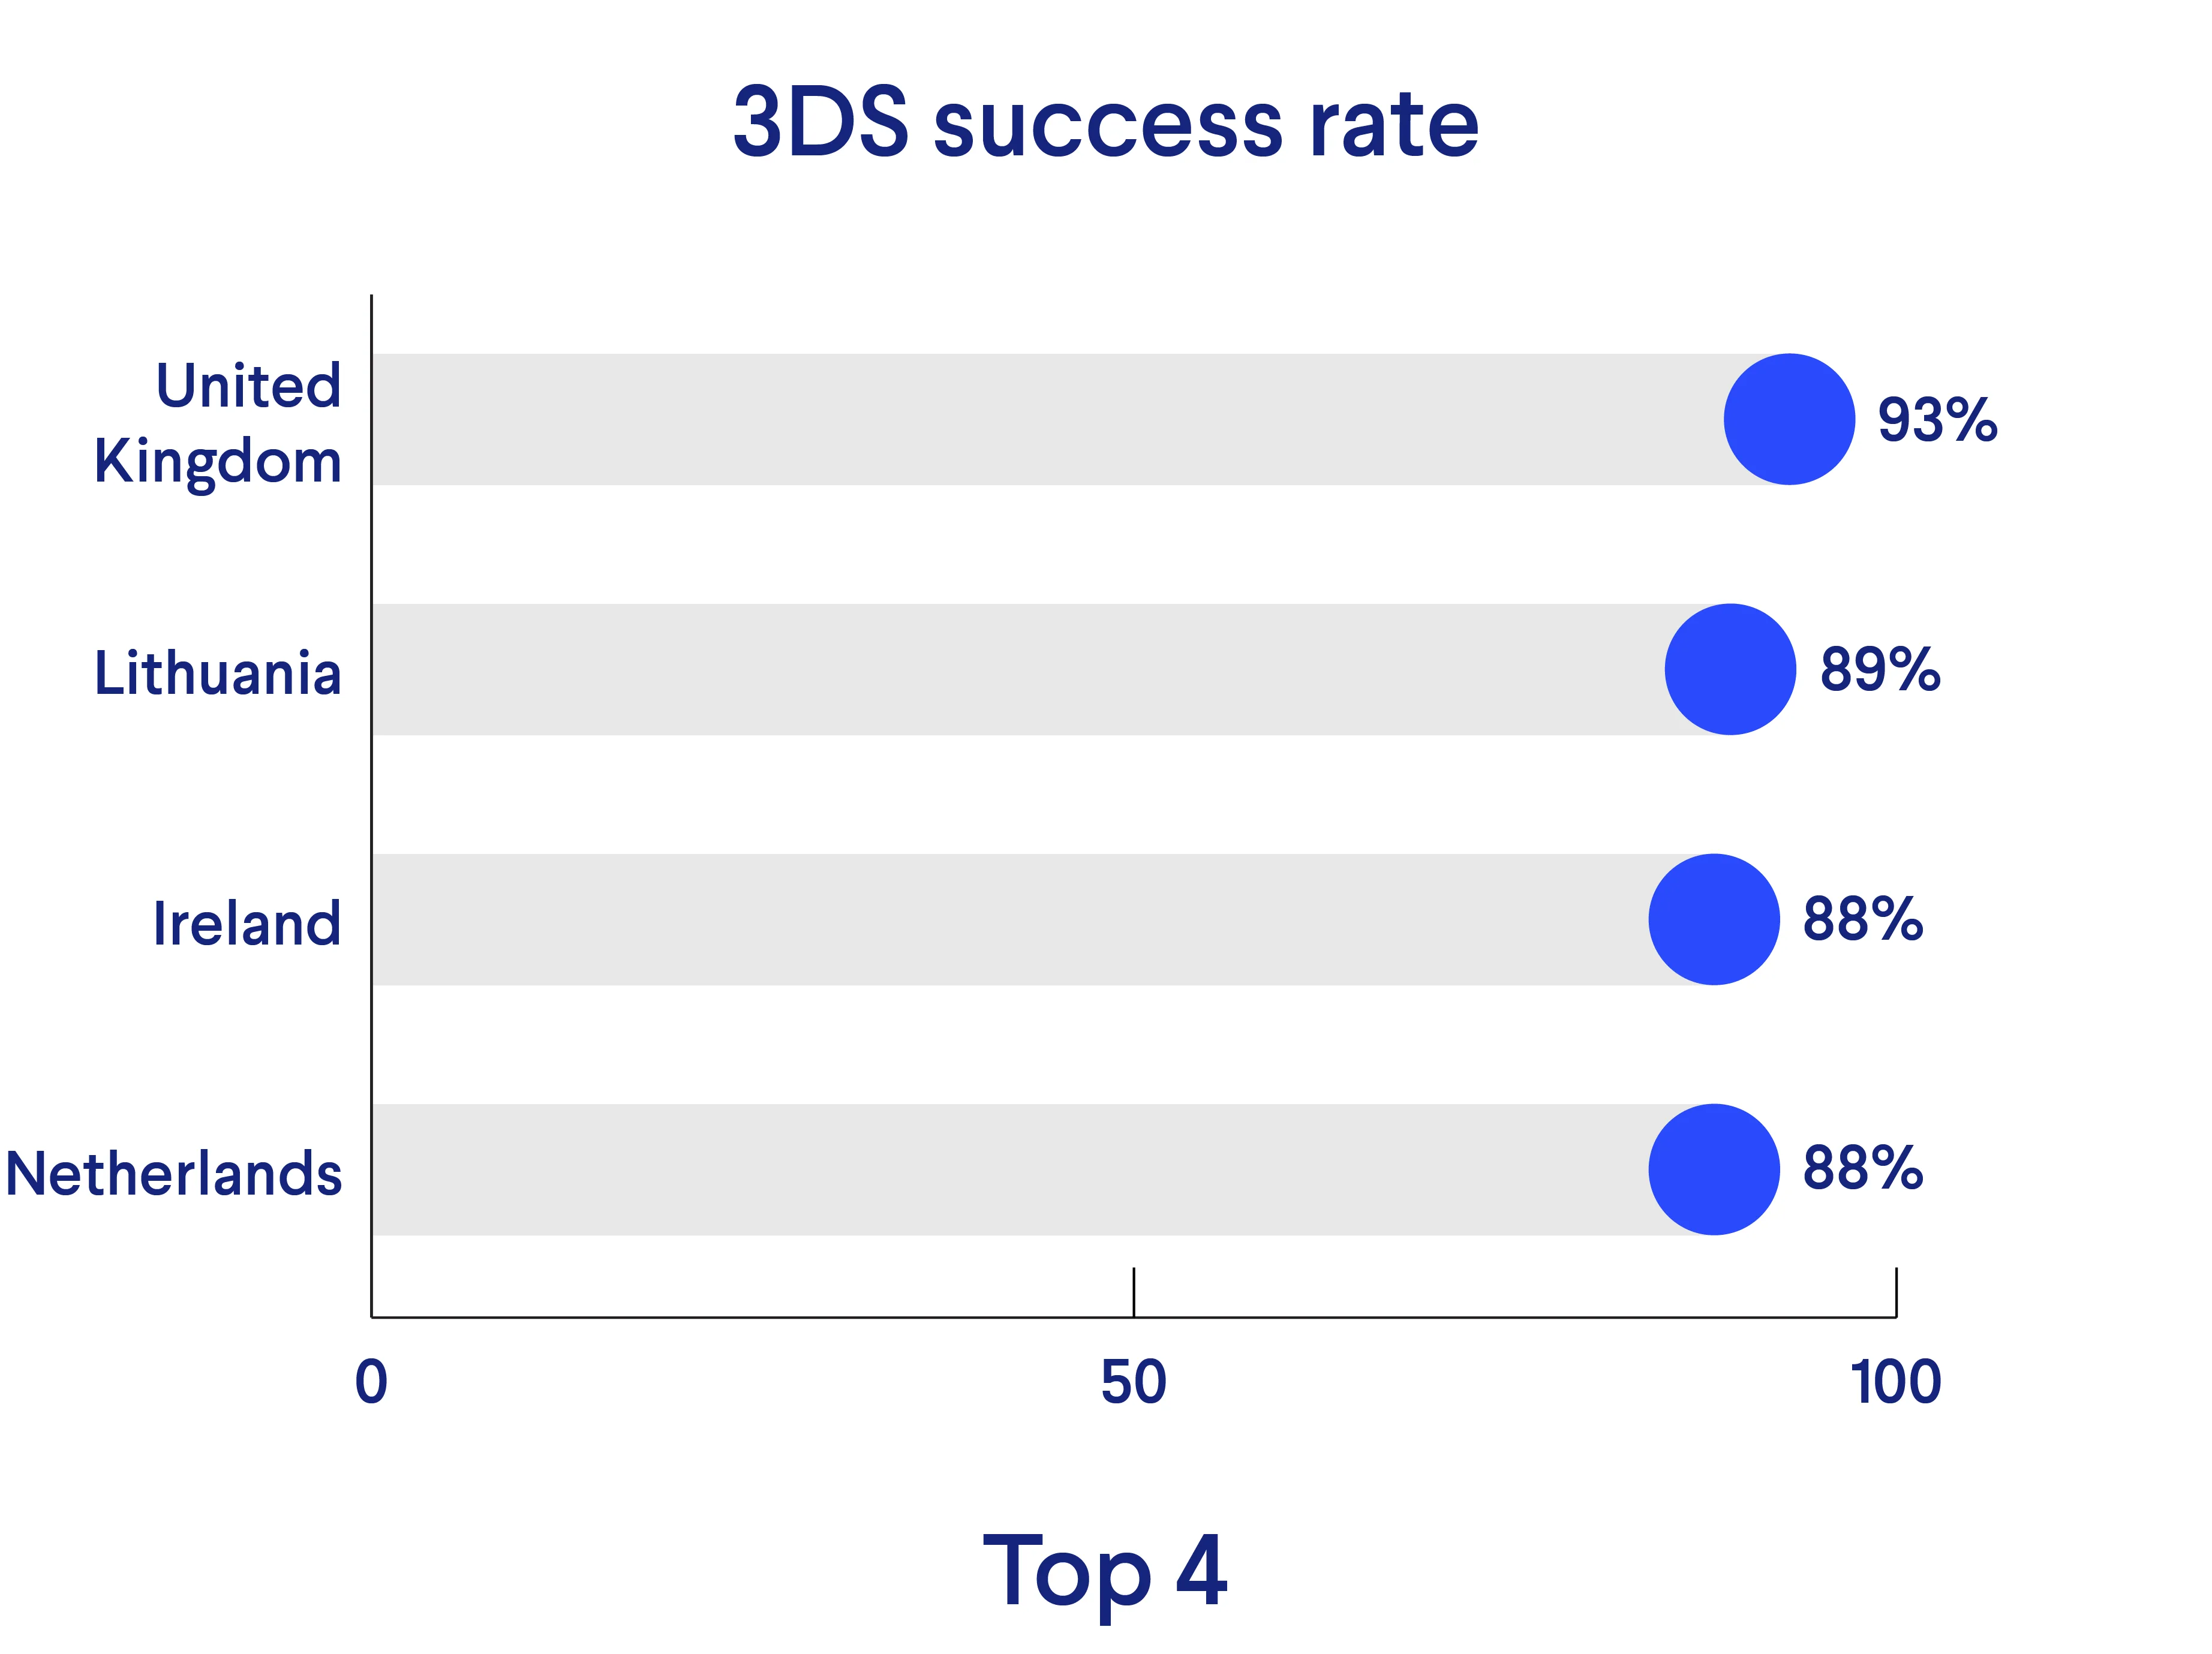
First off, let’s look at the 3D Secure success rate – which refers to the rate of success of 3D Secure authentication as a proportion of all payments sent to authentication.
In other words, the 3DS success rate refers to the overall 3DS authentication success rate, whether there has been a challenge or not.
Ravelin sourced and compared data from 37 countries and here are the results:
United Kingdom
Lithuania
Netherlands
Ireland
Iceland
Slovenia
Greece
Spain
Luxembourg
Italy
France
Sweden
Bulgaria
Estonia
Australia
Poland
Finland
Austria
Hungary
Germany
Slovakia
Cyprus
Canada
Croatia
Latvia
Malta
Romania
Portugal
Czech Republic
Denmark
South Africa
Norway
Belgium
Brazil
India
China
United States
We asked our resident 3D Secure expert, Product Director Catherine Jones, to comment on the rankings.
“The UK’s first position was expected, in a way, because they delayed the rollout of PSD2 and took it really slowly. It gave everyone more time to implement things properly from a technical perspective but also educate consumers about upcoming changes.
But the UK has used 3DS for a long time so it’s less of a big change for merchants as well as consumers – and banks.
Lithuania as well – we know that in the Baltics they used authentication even before PSD2. It’s in their payments culture. Consumers expect to see friction; it’s not surprising to see them doing so well.
The Netherlands is a welcome surprise because their top payment method for a very long time has been iDEAL, which is a non-card method. This goes to show that card payments are still doing really well regardless.
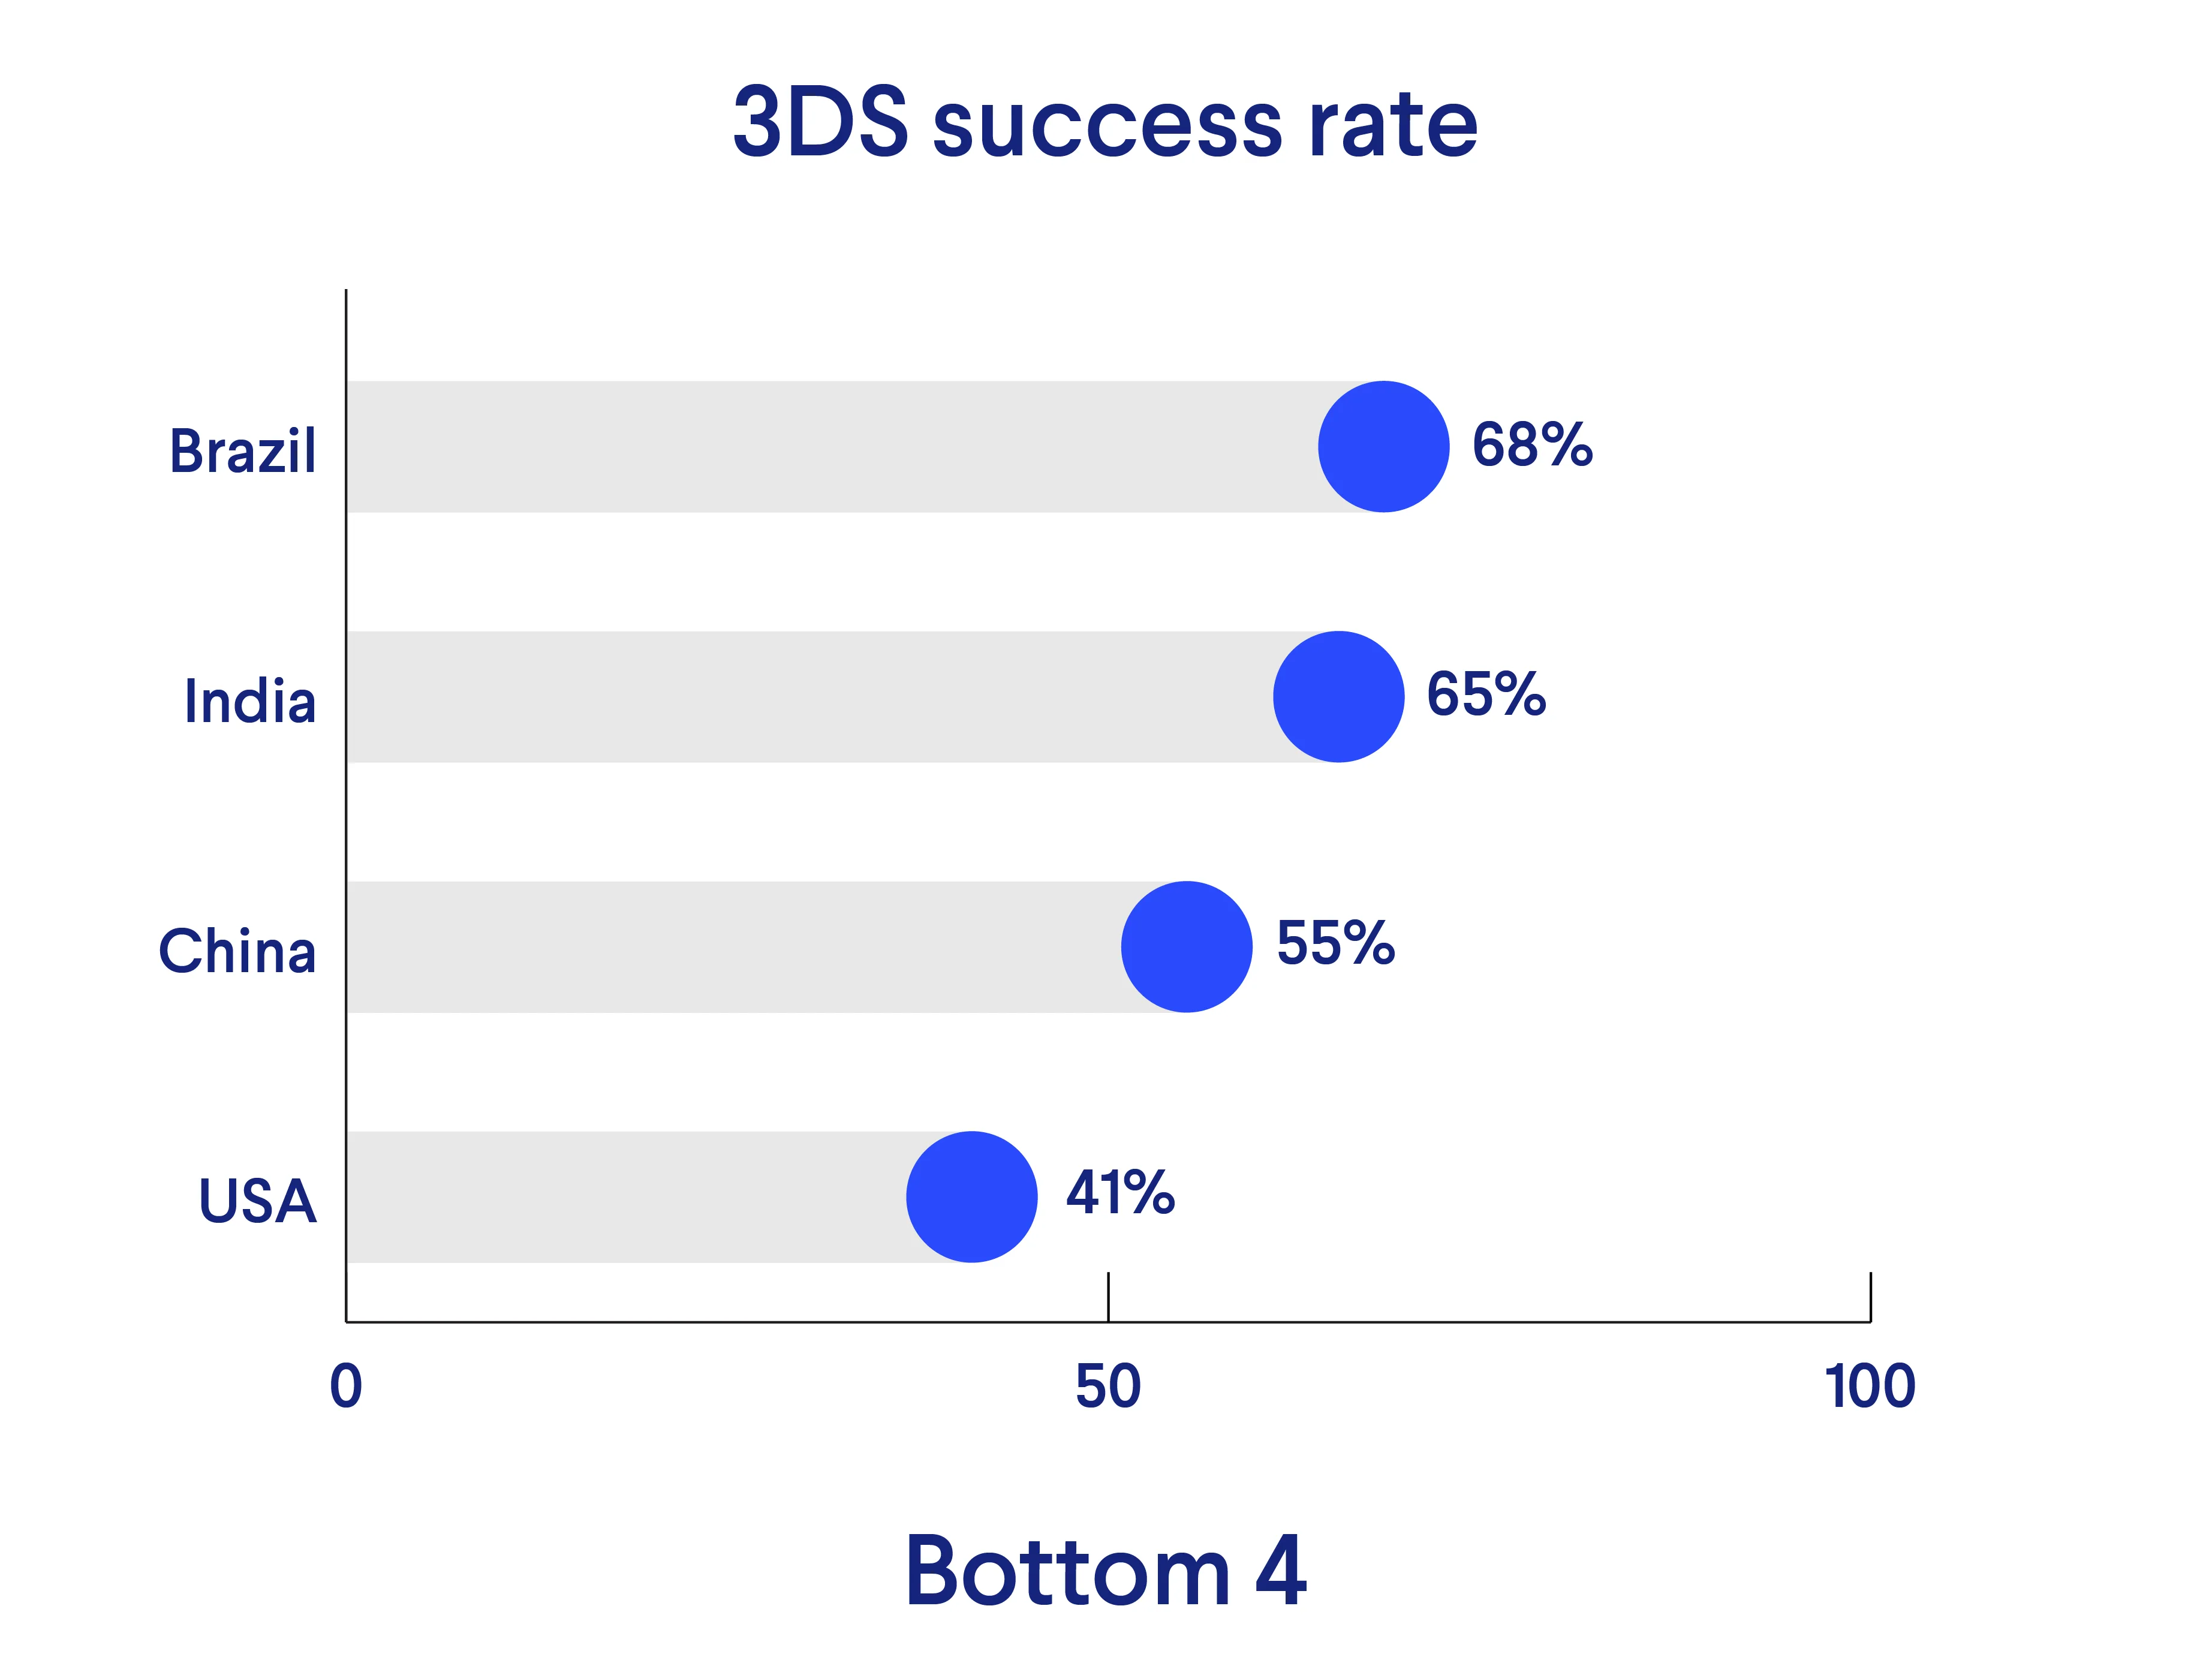
On the other end of the spectrum, the USA’s position is really worrying. Our previous data, from 2022, showed significantly higher authentication rates for this country, at 82%. In the years that followed, we’ve seen US merchants and PSPs discuss and possibly use 3DS more frequently. But are they using it in the best way? Liability shift is an incentive, but it could have led to highly suspicious traffic sent to 3D Secure – with issuers quite rightly being quick to reject fraudulent traffic.
The other three bottom countries, Brazil, China and India, are unique in how they establish trust online as well as their own domestic card schemes and payment methods. This could mean they’re not benefitting from the global learnings of companies like Mastercard and Visa."
Average 3DS challenge success rates – country head to head
Where there has been a 3D Secure challenge, what percentage of cardholders successfully passed the challenge, thereby authenticating themselves?
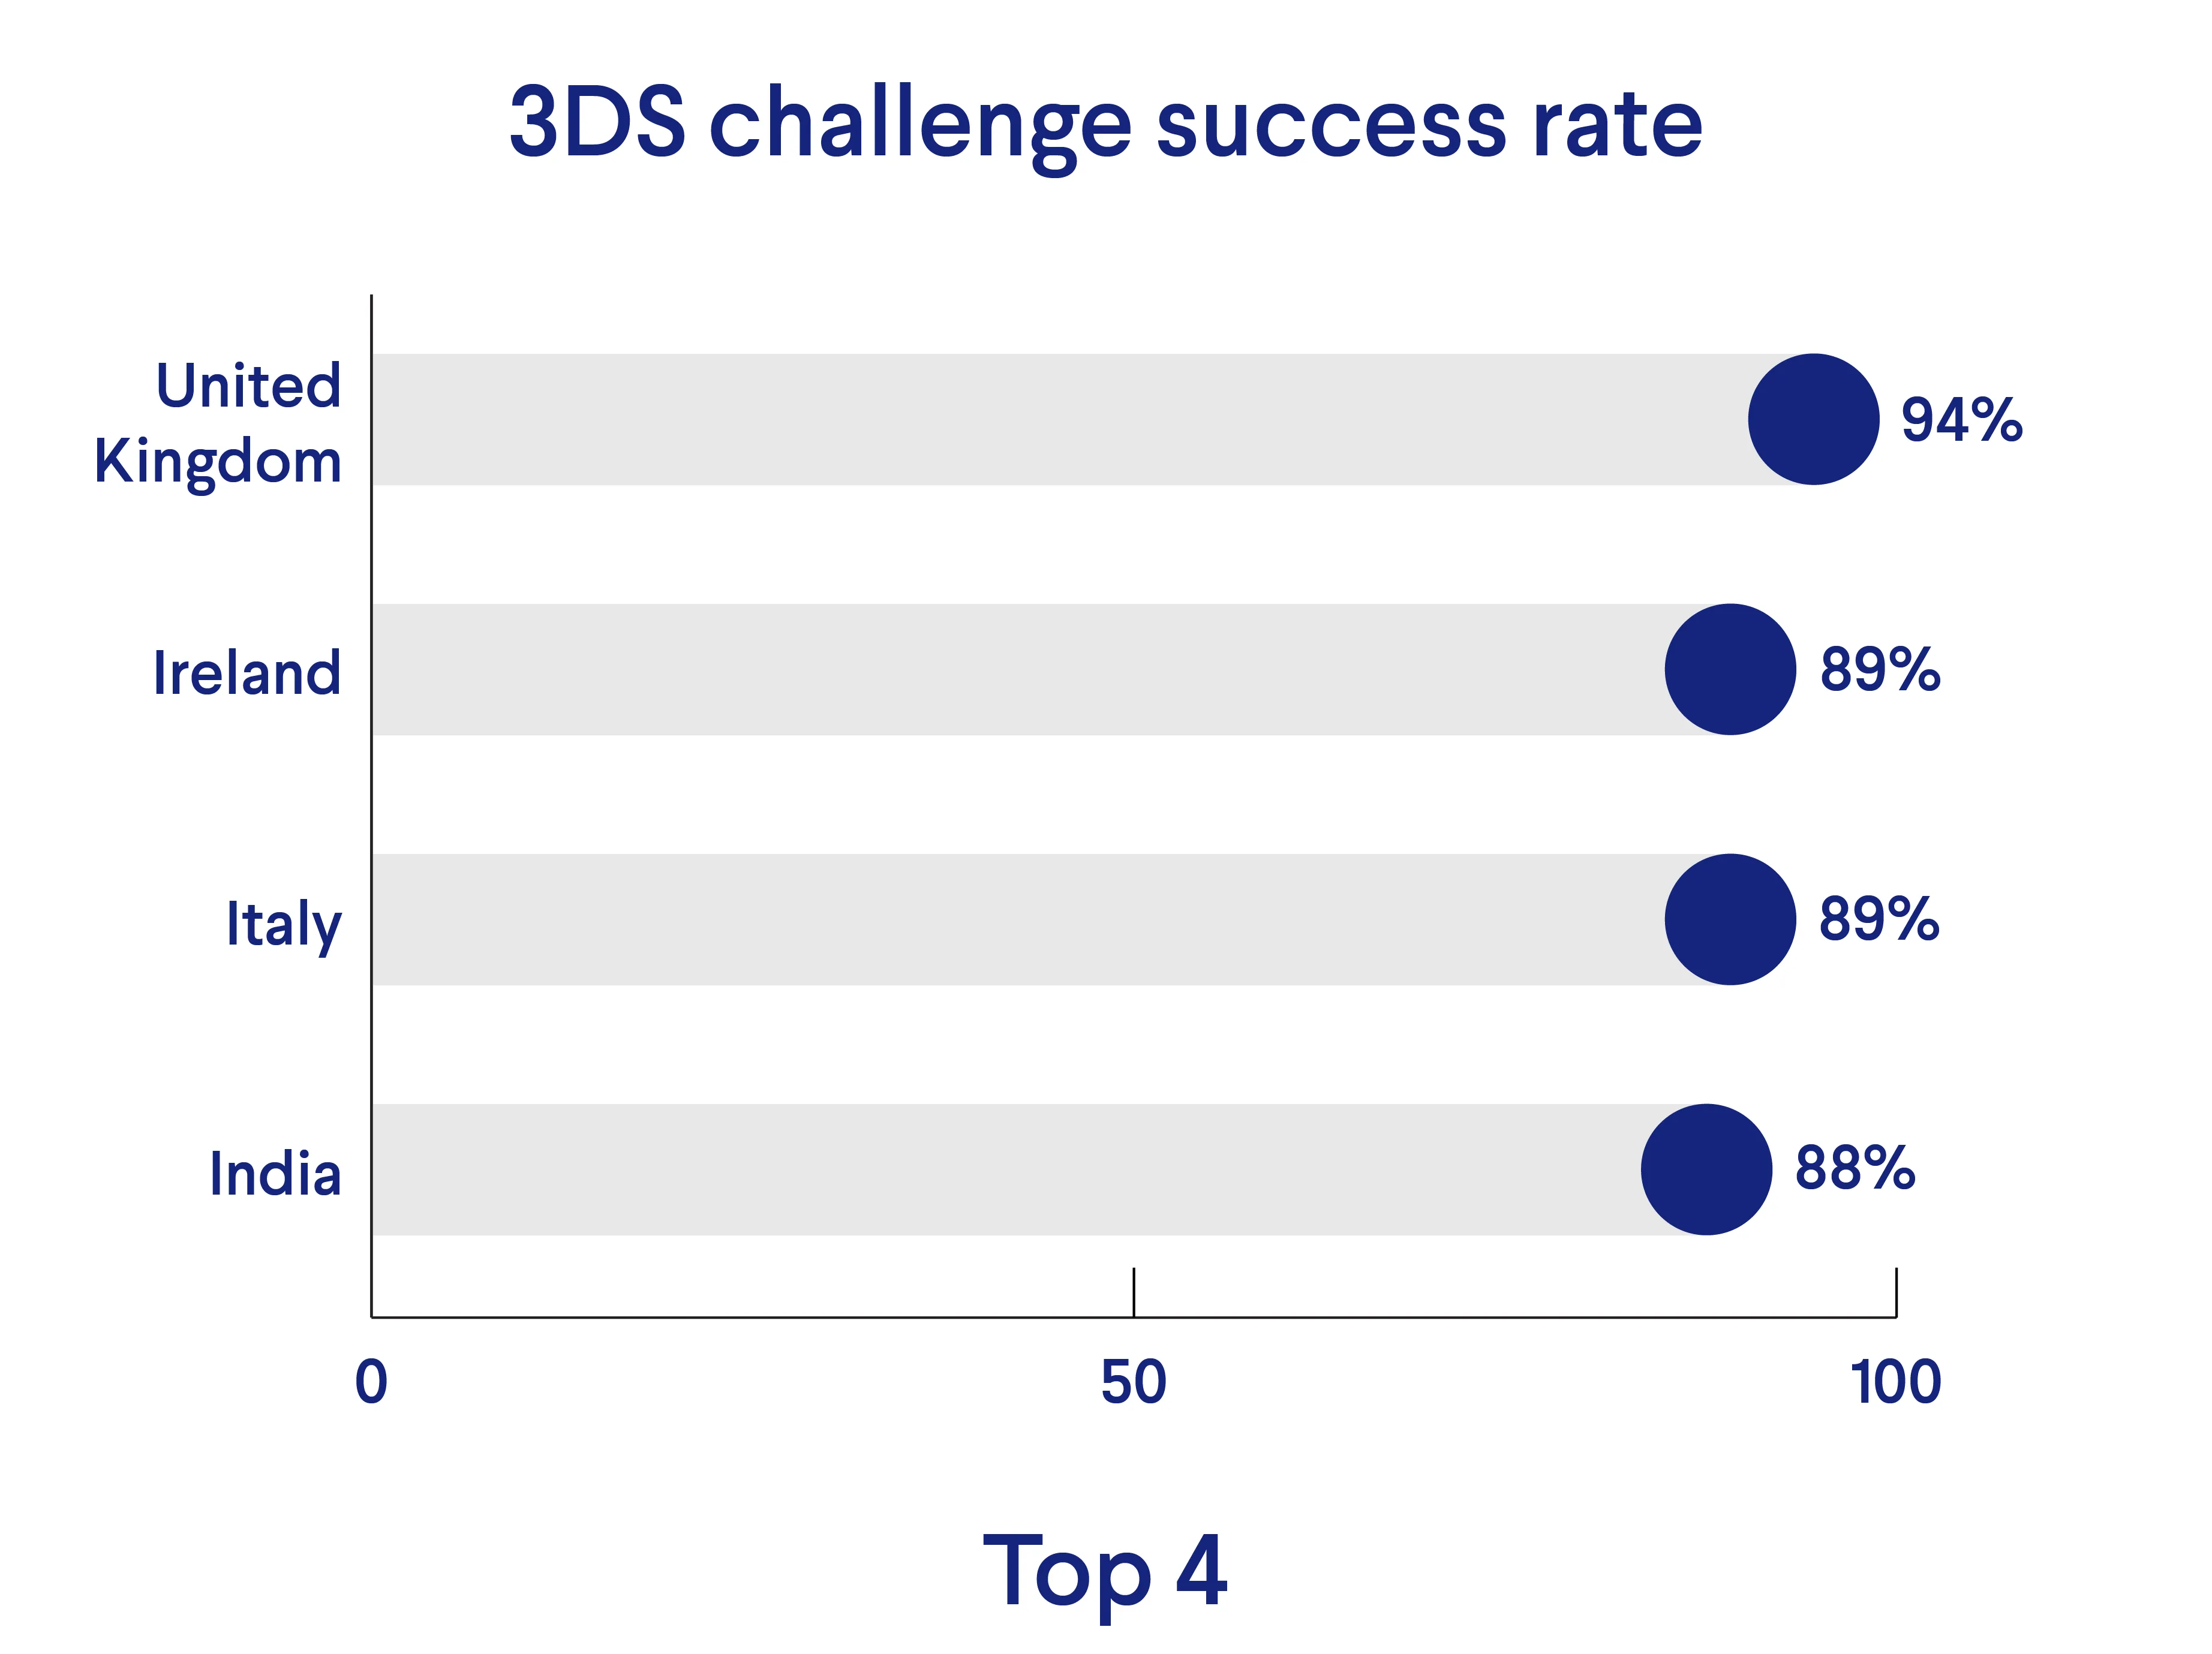
The 3DS challenge success rate is defined here as the rate of successful 3D Secure challenges as a proportion of all 3D Secure challenges issued.
And here are the rankings for all 37 of our countries:
United Kingdom
Ireland
Italy
India
Brazil
Germany
France
United States
Canada
Netherlands
Poland
Sweden
Slovakia
South Africa
Spain
Portugal
Australia
Luxembourg
Belgium
Greece
Estonia
China
Bulgaria
Iceland
Czech Republic
Lithuania
Romania
Norway
Finland
Croatia
Denmark
Malta
Slovenia
Hungary
Latvia
Cyprus
Austria
What are the likely reasons why some countries are faring better than others?
Catherine says, “The things that stand out to me immediately are that the UK, Ireland and India are all used to authentication. Having a challenge put in front of you as a consumer in one of those countries has been happening for well over a decade...
So people are more quick to follow instructions and take the action requested. I think this is true of all four of them and also a really positive reflection of how well the issuing banks are doing with the 3DS infrastructure on their side. And personally I’m really happy to see Italy performing so well knowing that pre-covid, cash was the dominant payment method in the Mediterranean country."
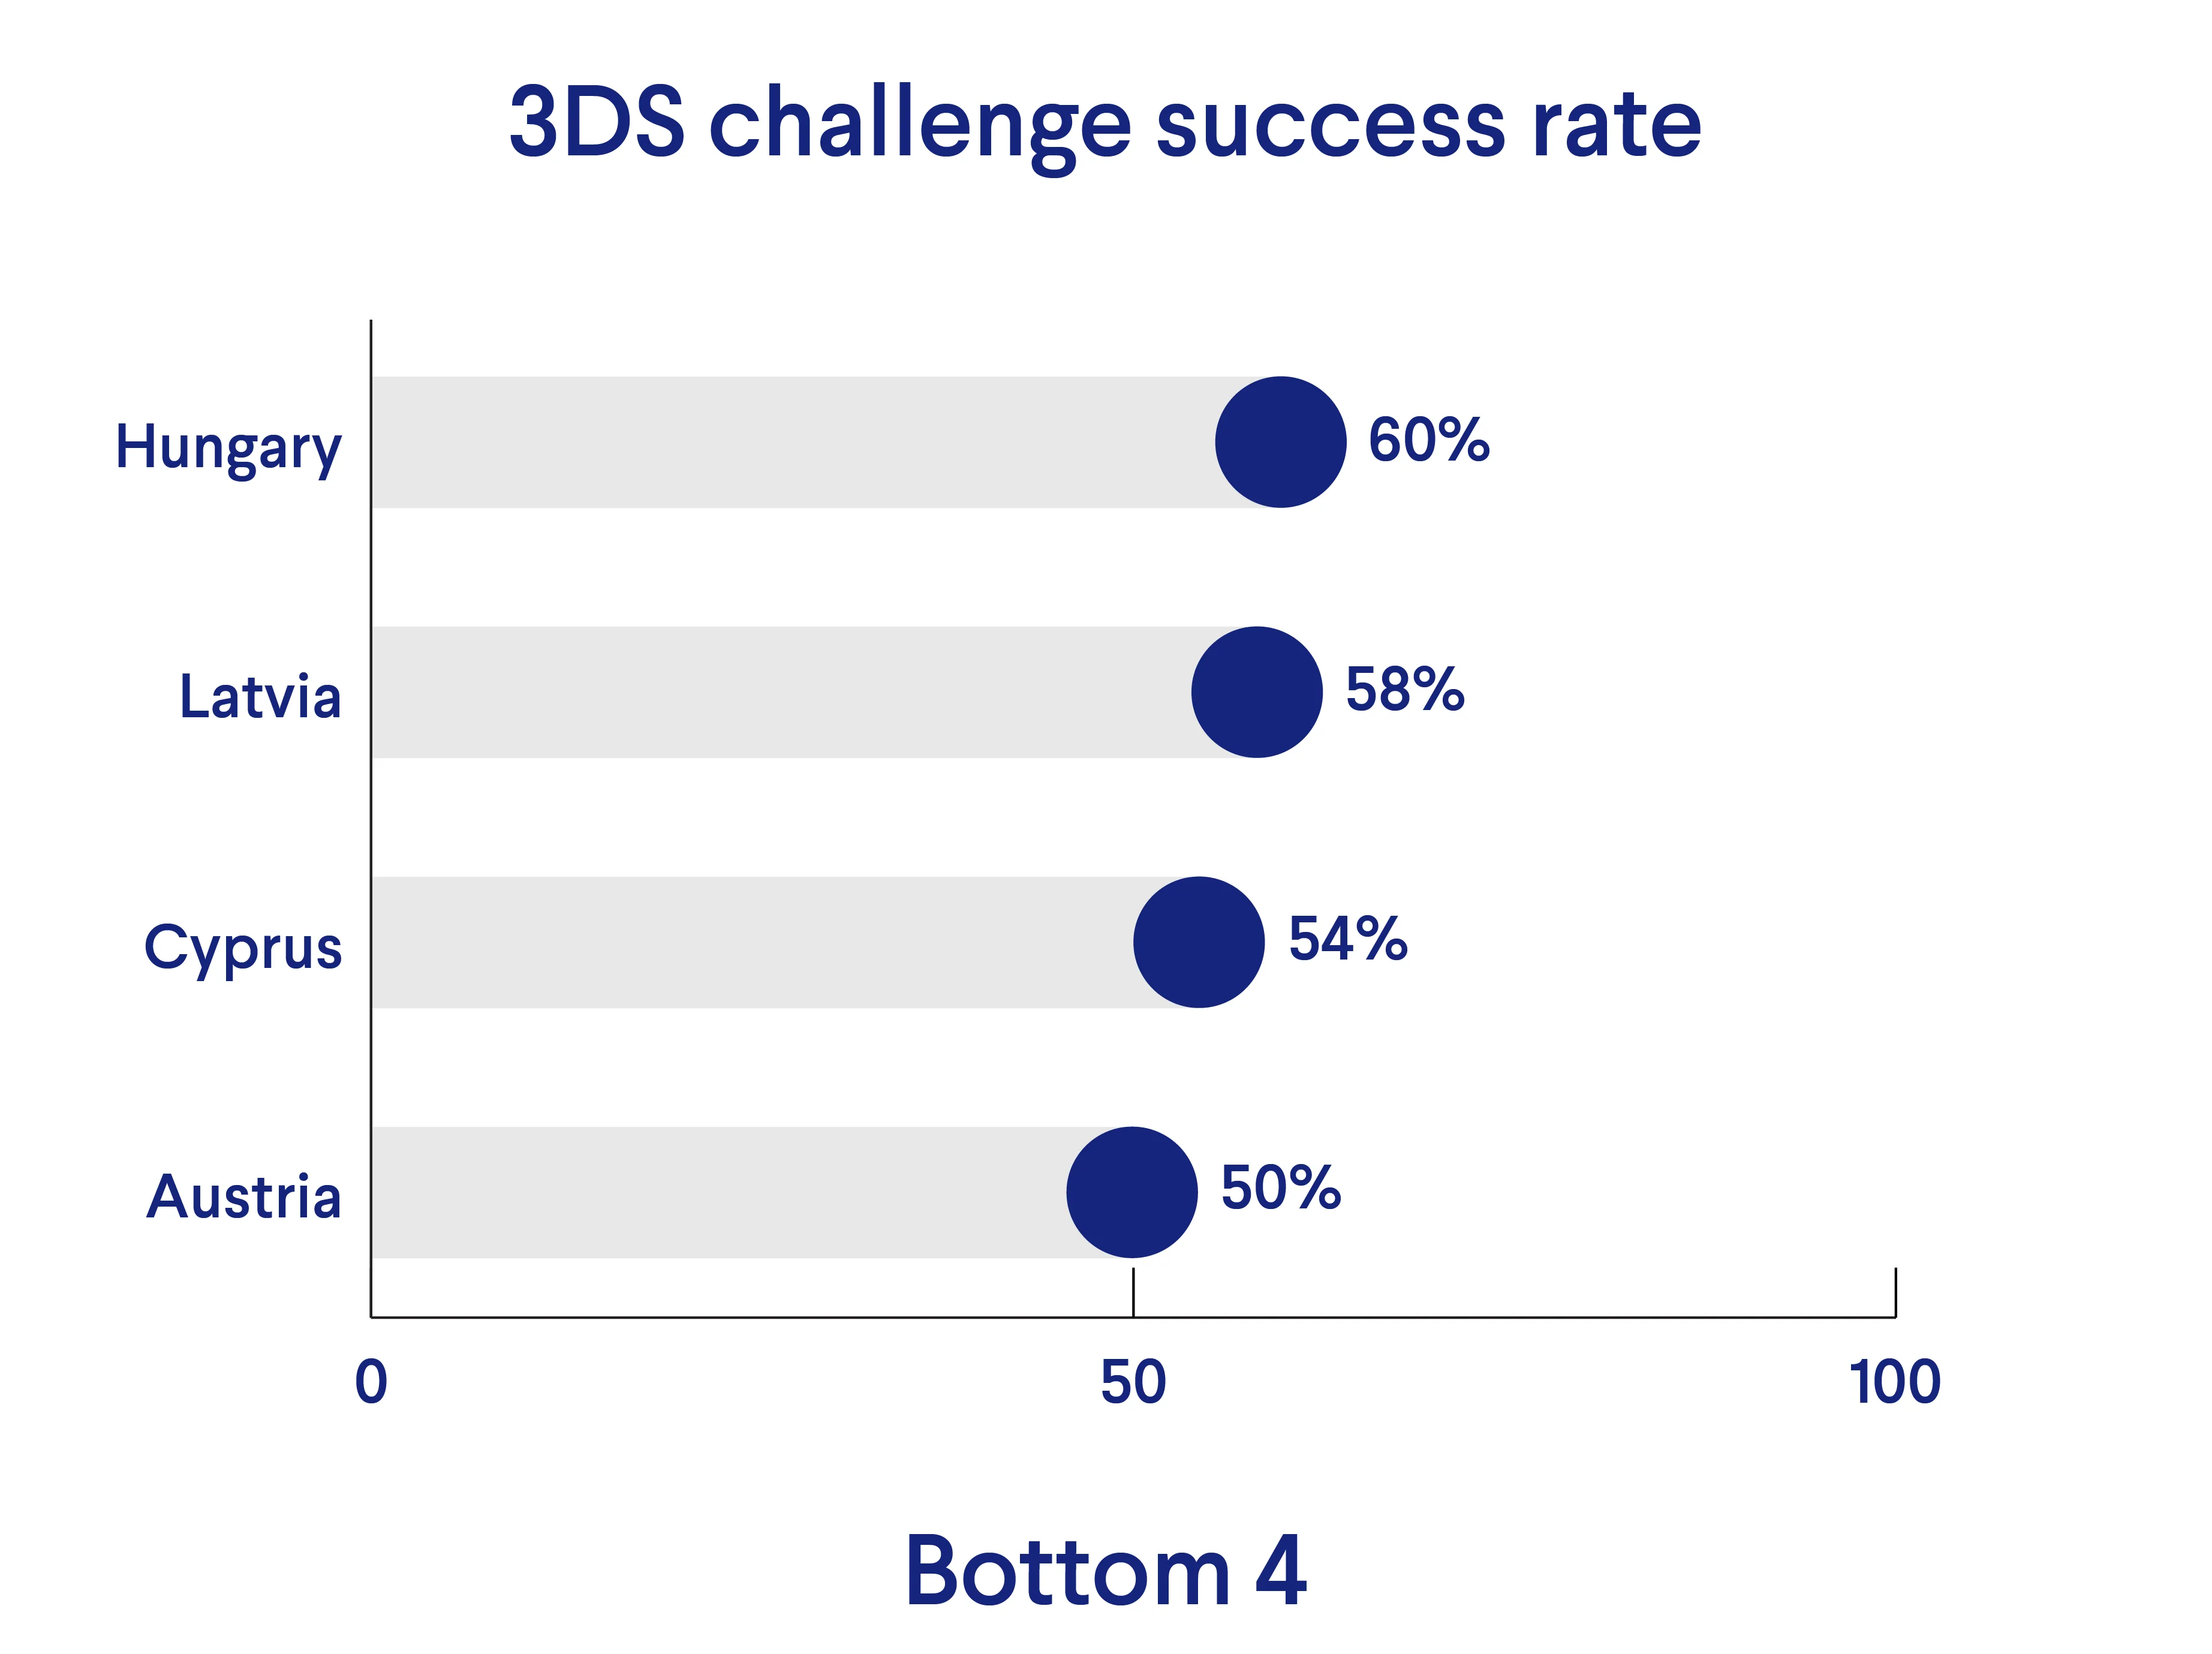
Commenting on the bottom four, she notes, “Latvia stands out to me. We’ve talked about how Baltic countries are used to authentication but perhaps merchants and banks in Latvia are still using other forms of authentication that aren’t 3DS. It’s worth noting that some of these countries that don’t perform as well in the challenge rate put through more frictionless traffic. For example, Austria has 50% 3DS challenge success rate but 76% frictionless rate.
But regardless, I’d advise merchants who see similarly low rates to talk to their 3DS providers on strategies to improve these rates.”
Frictionless authentication country comparison
Finally, it’s interesting to consider the frictionless rate, especially because it indicates how many are enjoying shopping and payment journeys that are not interrupted by checks.
The frictionless rate we’ll compare below is defined as the rate of authentication attempts were authenticated without a challenge.
There are cultural differences between these countries, as I mentioned earlier. But it’s safe to say that almost all countries do appreciate less friction when it comes to payments.
Well done, Lithuania! They are performing very well, topping the frictionless rankings as well as being second of 37 countries for 3DS success rate.
Earlier, we talked about certain countries being used to authentication and being challenged because it made people feel secure. It’s interesting to see Lithuania and Iceland perhaps moving away from that, with a really high frictionless rate.
Perhaps that’s a sign that their merchants have more faith in 3D Secure as a way to secure transactions without the friction. Shoppers are more savvy too, understanding that even when there is no friction, there is robust infrastructure to secure their accounts and cards. In a way, it’s the opposite of the USA because shoppers in the Baltics tend to view a 3DS challenge as a sign that the merchant is looking out for shoppers' interests and protecting them.
Bulgaria and Slovenia have also done well although the payment culture seems different to the other pair we’ve looked at. Perhaps here it is a matter of banks being more confident, or that merchants are sending the right traffic to 3D Secure.
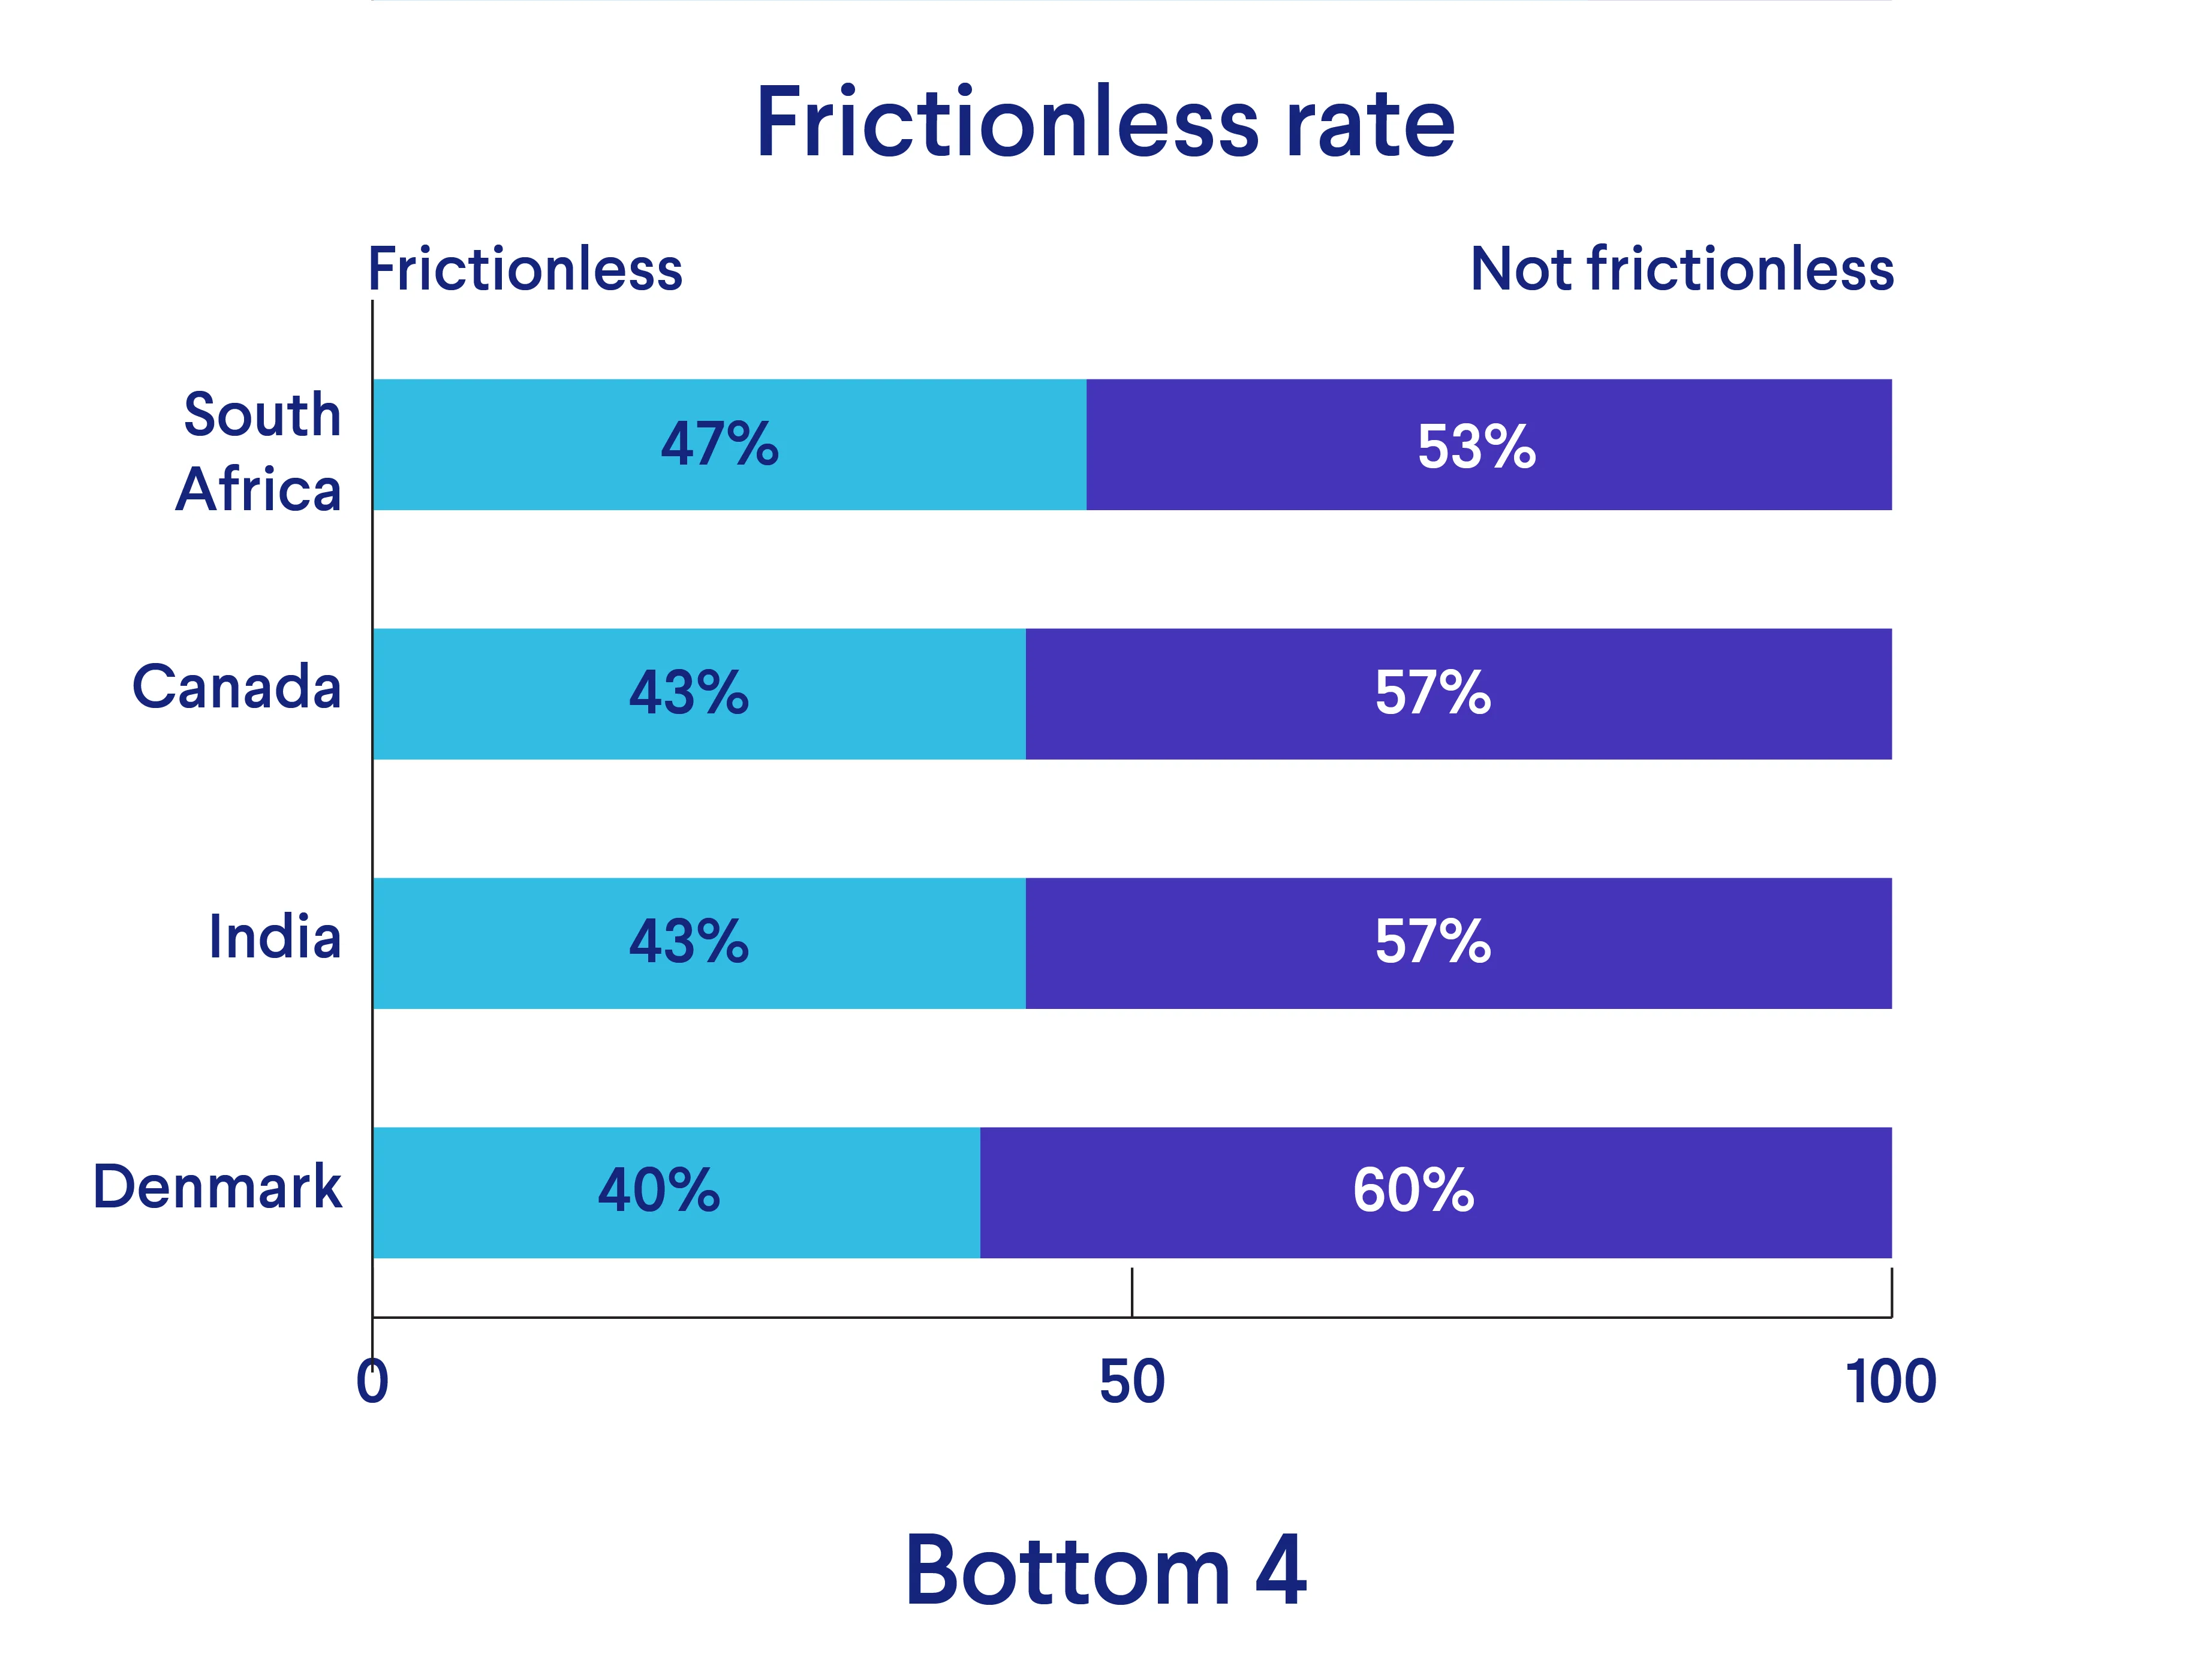
Worth noting is that South Africa and India have their own SCA requirement. We would expect there to be a slightly higher challenge rate because of this.
In Denmark, MobilePay is used for pretty much everything. Because of this, not as many transactions employ 3D Secure and therefore merchants and banks may have less incentive to learn to make the most of this technology. MobilePay does have its own authentication method built-in.
Parting thoughts
On the back of these findings, Catherine has some advice for merchants:
“Remember that 3D Secure compliance does not mean always introducing challenges. Doing 3DS well means you can find that sweet spot between protecting your revenue from fraud and staying on card schemes’ good books on one side, and providing a smooth shopping experience on the other.
To better understand how to do this, talk to your 3DS partner today.
Make sure you’re aligned on:
What’s working
Why it’s working
How it’s working
What’s not working
Why it’s not working
What can be improved
To discover more granular data as well as advice around Secure Customer Authentication – PSD2, payments fraud and 3DS, download the Global Payments Report 2025.